
Table cards overview
Table cards overview
Table cards live on dashboards within Junglytics. These table cards can display several metrics across regions, products, ASINs, or variations, making it easy to compare multiple things at once.
Creating a table card
Creating a table card
To create a new table card, scroll to the bottom of any dashboard and click the “Add New Card” button or hover between any two cards and click the “+” button. A menu will appear showing different card types. Choose the “Table” option.
The top-left corner will read “Table grouped by” followed by a dropdown menu. You can select region, product line, primary variant, secondary variant, ASIN, or SKU. You can narrow things down further by clicking the + sign to add a secondary metric; or by clicking the down arrow within any of the rows on the table card to add a secondary metric.
The table card will include several columns showing metrics for each row. You can add additional columns by scrolling right and clicking the + sign.

Managing table cards
Managing table cards
You can reorder the rows by a specific metric by clicking at the top of each column.
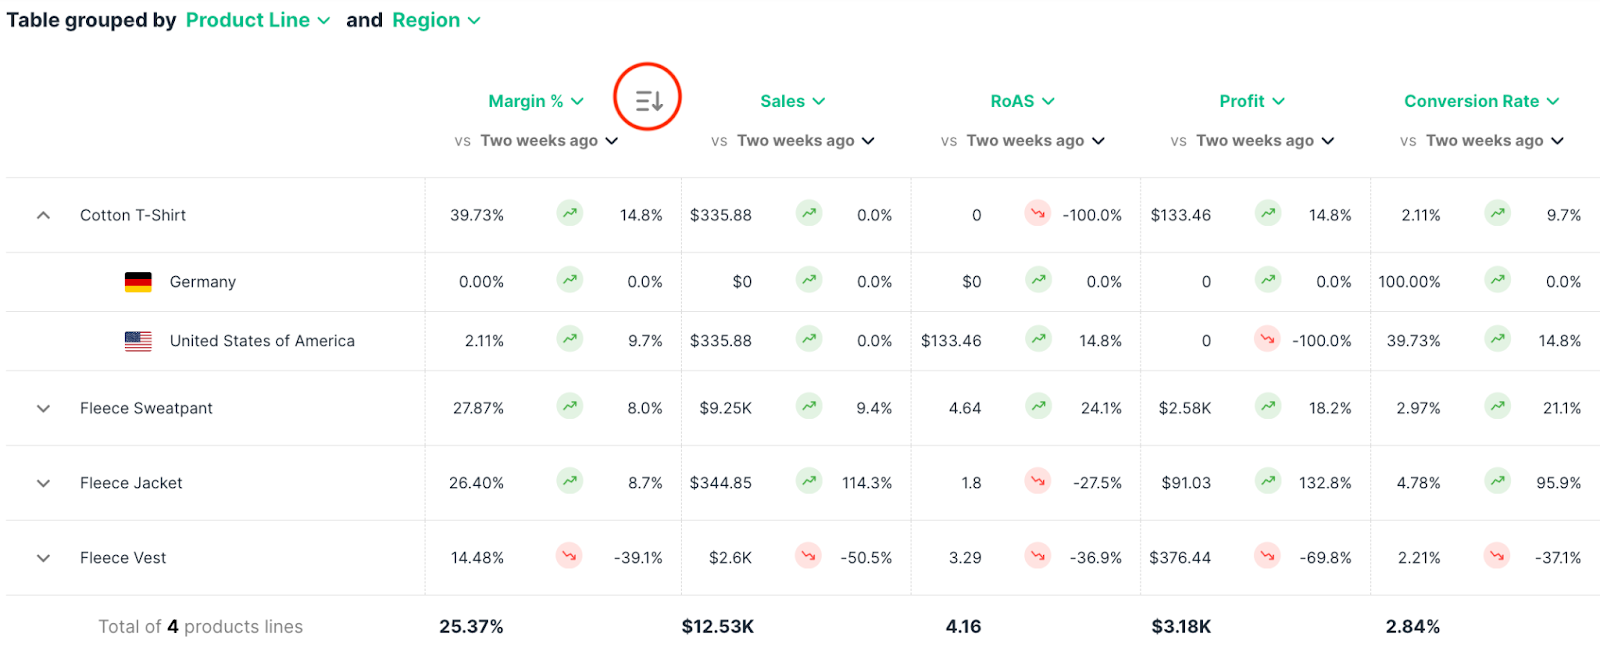
Change any of the column metrics by clicking on the down arrow and selecting the metric you want to see.
To delete a table card, click on the three-dot menu in the top right corner, and select "Delete Card."